How to monitor activity in your local StreamX Mesh
This guide illustrates how to monitor activity in your local StreamX Mesh by using the observability tools included with StreamX on your local instance
Prerequisites
Ensure you have the following before proceeding:
-
Running StreamX Mesh
| Verify observability features are enabled. More info here |
Logs
In a local environment, StreamX Mesh runs on Docker. Each microservice is a separate Docker container. To view logs, the docker logs command can be used.
-
Find the service whose logs you want to view:
docker ps --format "{{.Names}}" -
View the logs from the container:
docker logs -f <name_or_id>
You should see the logs from the given microservice in your terminal.
Tracing
StreamX includes Tempo, which provides tracing backend for Grafana. This allows you to see how messages flow through the mesh. This feature can be helpful in verifying if a message is propagated through the services it is expected to be processed by.
-
Open the Grafana explorer, which is exposed at
http://localhost:3000/explore. -
Choose
Tempoas datasource. Then setQuery typeto`Search`. -
Click
Run Query. You should see a list of matching spans, such as: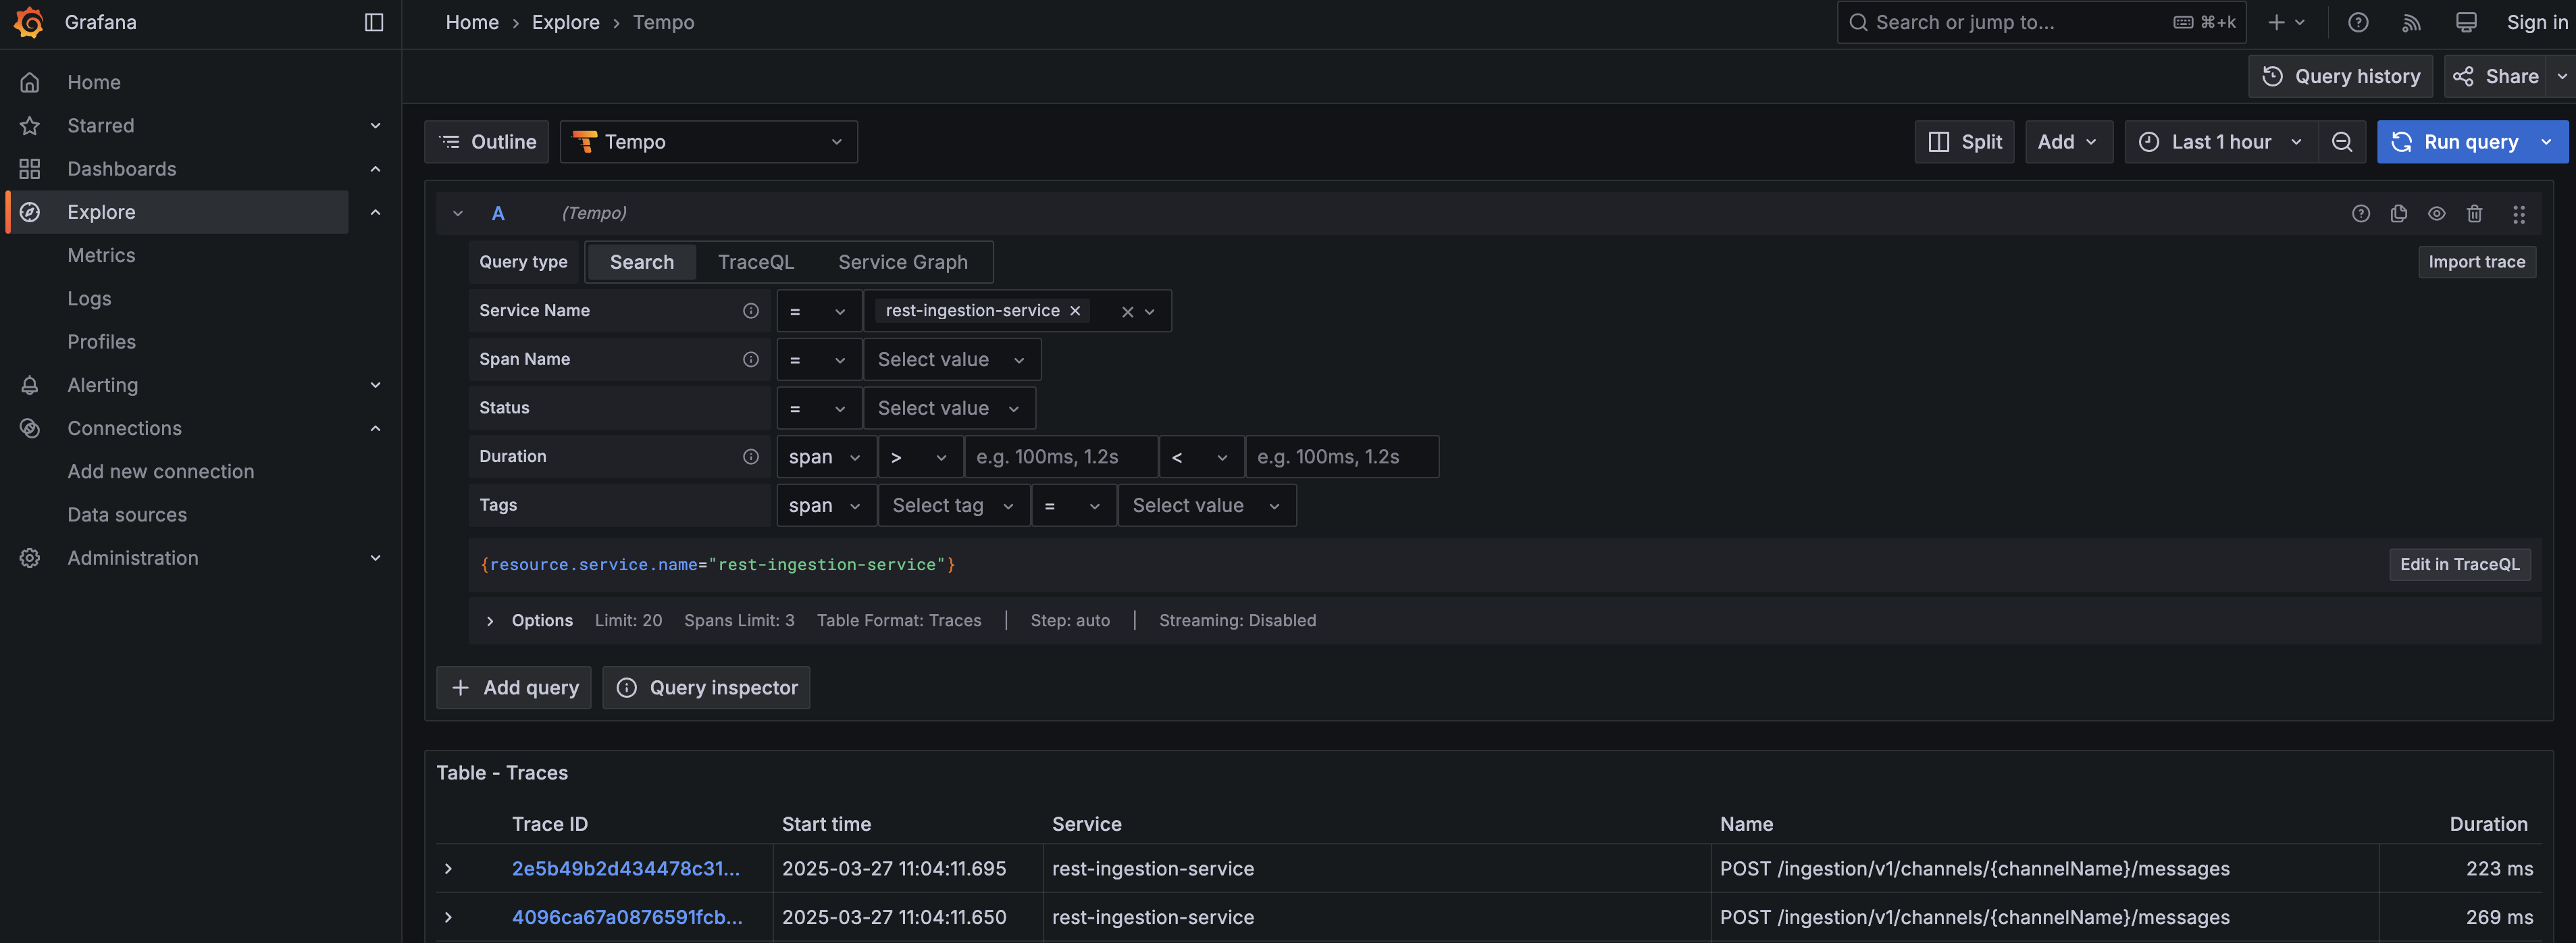 Figure 1. Tempo traces
 -
You can go to the details of each trace by clicking on it. There you will find more detailed information about each span.
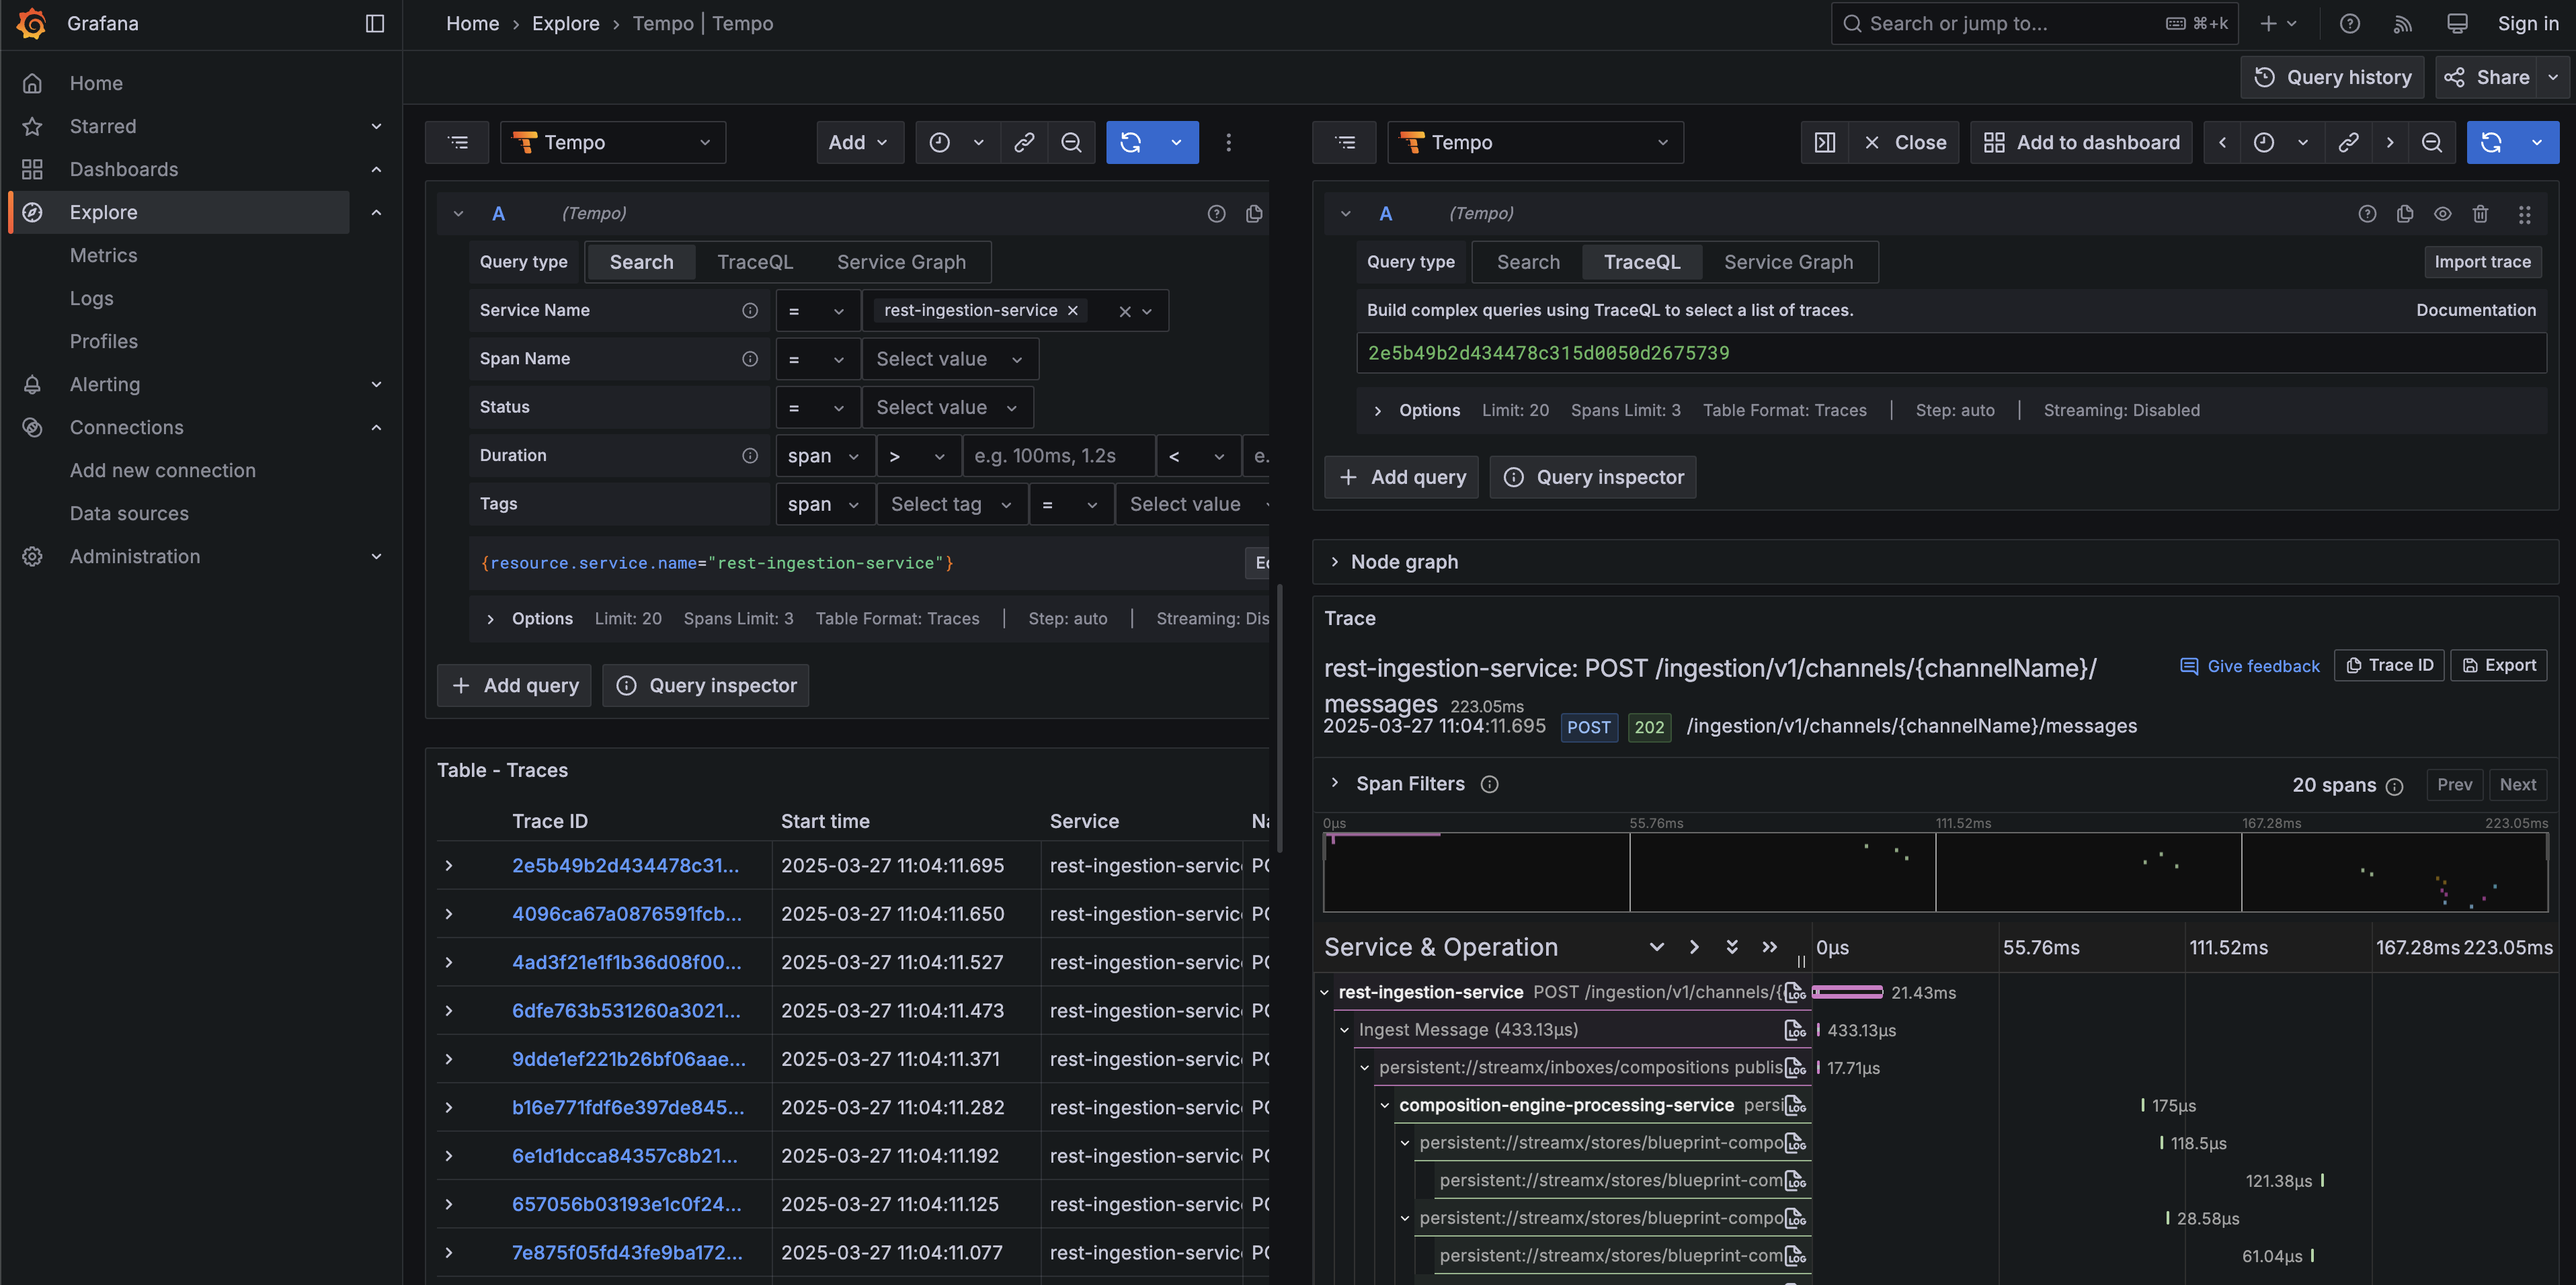 Figure 2. Trace details
Metrics
Metrics in StreamX are presented on a Grafana dashboard.
-
Open the Grafana UI, which is exposed at
http://localhost:3000. -
On the Grafana site, go to the dashboards section and look for the
StreamXDashboard.
By default, there are also JVM and Pulsar dashboards that can provide specific metrics.
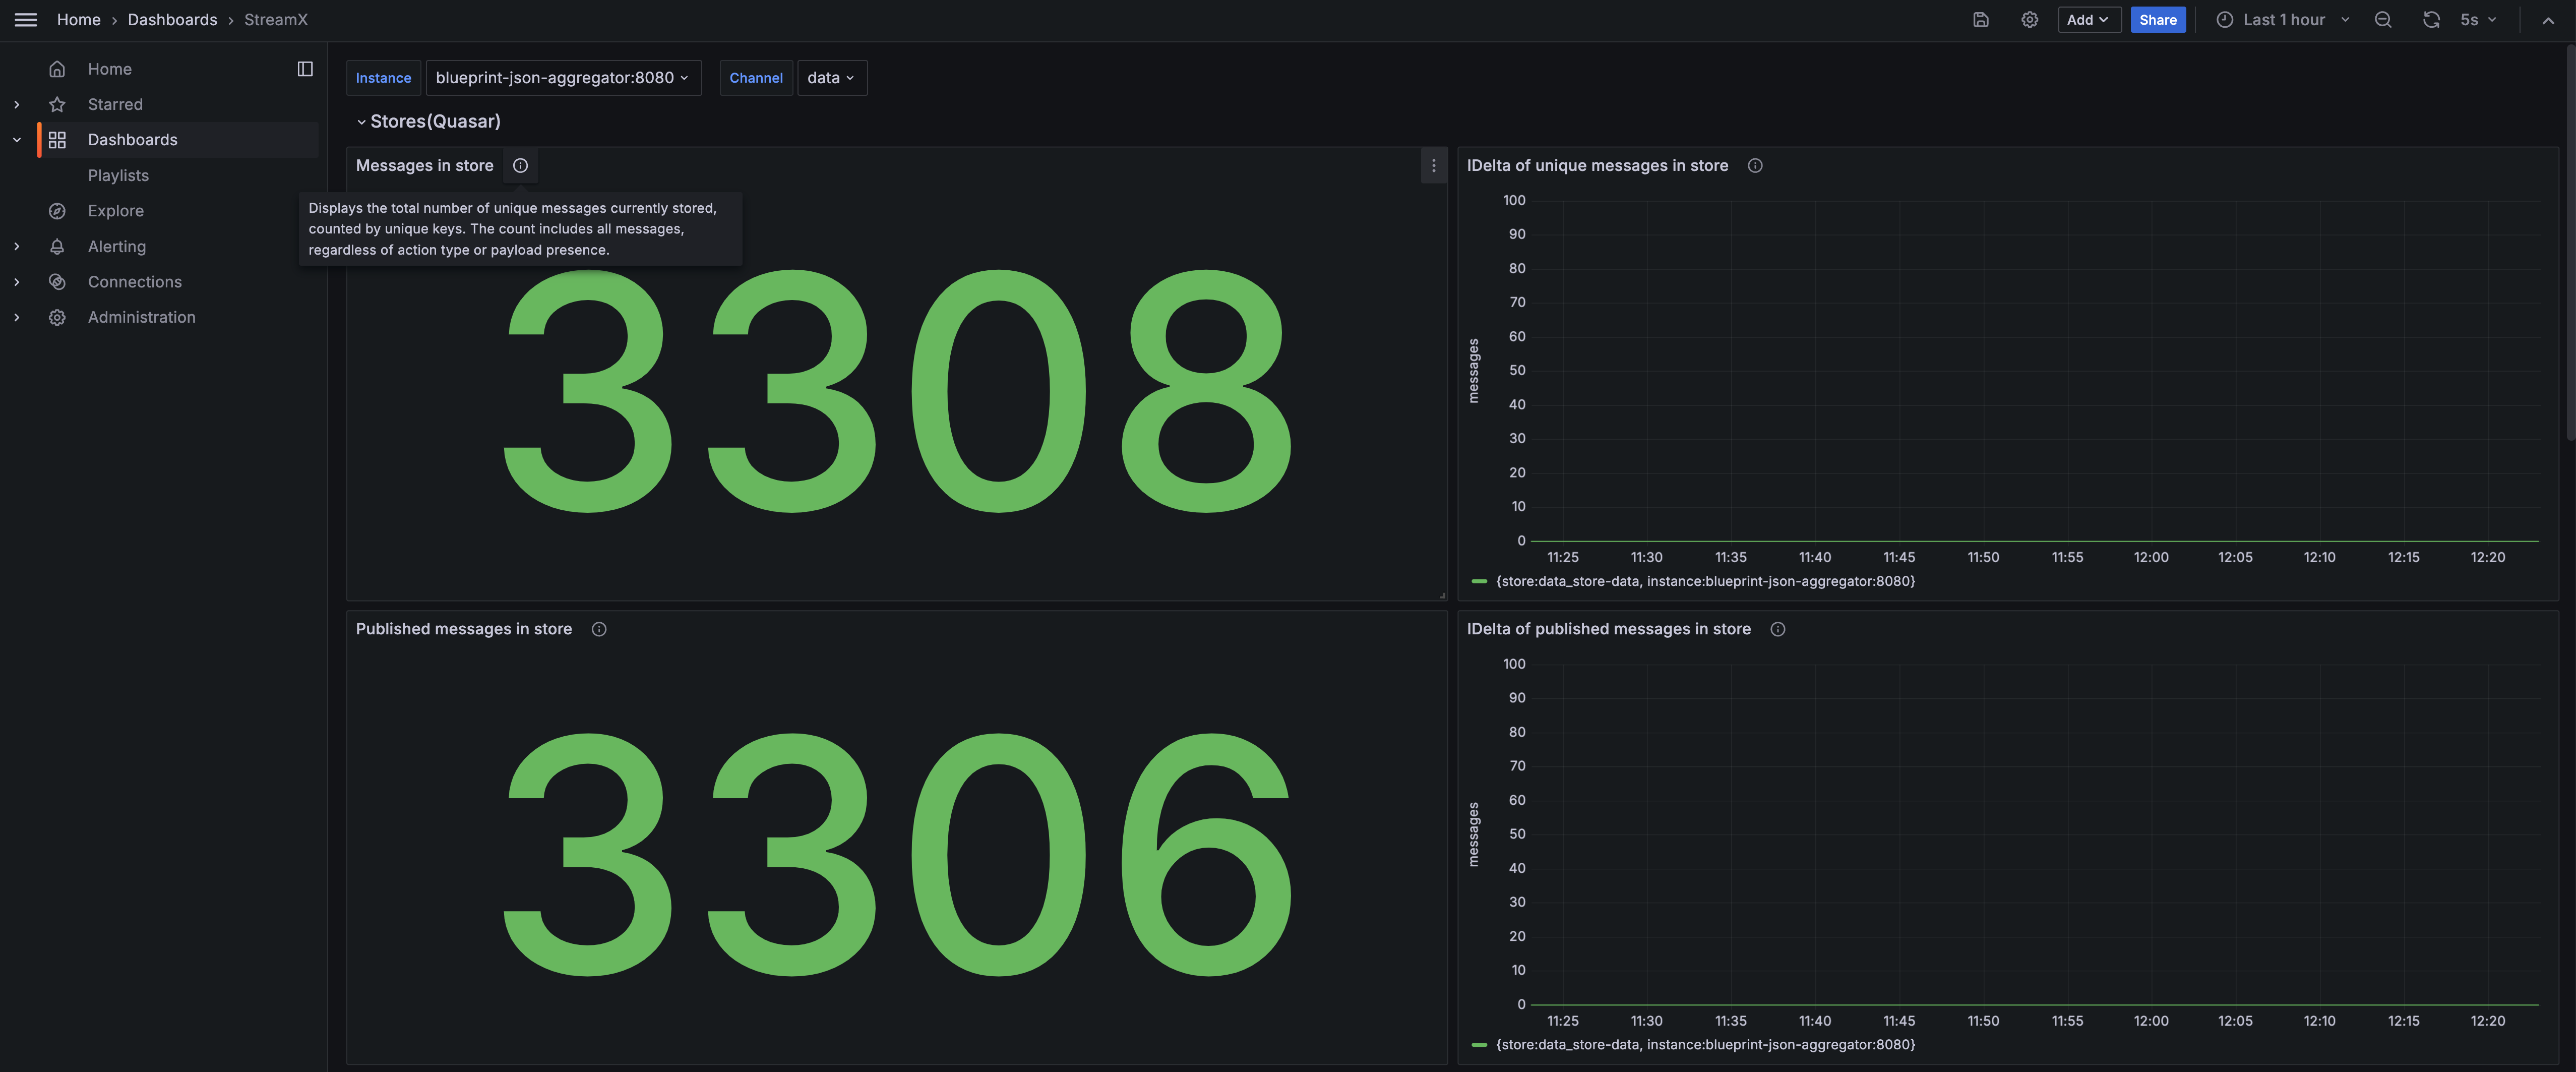
Working with the StreamX Dashboard
At the top of the dashboard, there are variables to filter the services whose metrics you are interested in. The more services you have in your mesh, the harder it becomes to read the default view of the dashboard. Therefore, it is recommended to start by filtering the results.
The StreamX dashboard consists of the following sections:
-
Stores(Quasar): Displays information about the status of stores. -
Traffic(Quarkus): Provides information about traffic in StreamX services.
Each panel includes a detailed explanation that appears when you hover over the ℹ️ icon next to the panel name.
Feel free to explore the rest of the dashboards.